
What is deconvolution and how is it useful in analyzing data?
360-449-3091
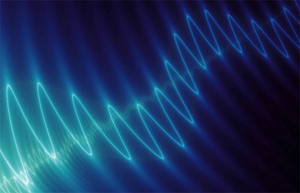
The Signal as a Waveform
If you think of your data as a type of signal or waveform it is easier to understand how and why derivative spectroscopy can be used to focus on the data of interest. Although most assays focus on “peak absorbance”, it is important to remember that the point of peak absorbance is a small part of a larger continuous “line” of visible spectra that when scanned produces a sort of wave.
Waveform Additions Produce Convoluted Data
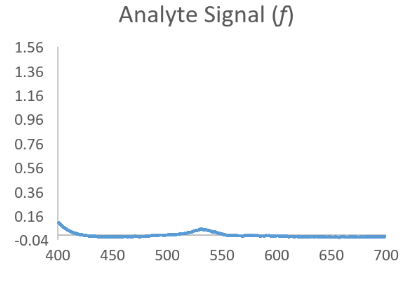
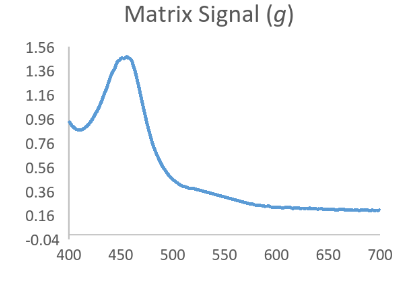
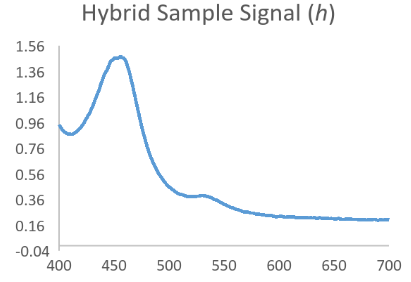
Now consider that the analyte of interest will generally produce a nice bell shaped spectral scan when assayed in a pure system such as with calibrator only data. Then consider that a complex sample matrix without any analyte would have its own representative spectral scan that is unique for that specific sample matrix. When we think of our data in this fashion it is easy to see that an absorbance scan for the reacted sample is a combination of the above waveforms which have been convoluted into a hybrid signal.
Resolving Signal Components Using Deconvolution Methods
In the equation h = f * g, if we assume that f is the function behind the true signal of interest, we can see that knowing a bit about the original function g might allow us to make a mathematical estimate of the original function f by itself as f = h/g. While not exactly that simple, this is the principle behind Fourier Transform based deconvolution which seeks to define a function for the interfering or baseline signal so that it can be used to mathematically define a function for just the analyte peak before it became convolved.
An easier method of deconvolution involves the use of derivative spectroscopy or derivative analysis.
Recall from elementary calculus that a derivative is defined as the instantaneous rate of change for a function or Δy/Δx. This is an important concept when considering plots of absorbance vs wavelength. If one thinks about this for a moment it should be clear that “rate of change” values are independent of their location along the y axis because they describe a change in amplitude over a defined period rather than absolute absorbance at a given wavelength.
Imagine two identical curves along a single skewed axis. Both curves would display the exact same rate of change while travelling along the curve, the exact same area under the curve and yet could have absolute peak absorbance values that differed by 10X or more. This concept highlights how derivative analysis serves to “level the playing field”.

By considering the derivative amplitudes for just the peaks of interest, non-analyte associated background is essentially negated. Thus, when used appropriately and in the correct circumstances, derivative analysis is a very powerful analytical technique that can eliminate the need for complicated extractions and blanking procedures.
Why are derivative plots sinusoidal?
If you think about the rate of change value in terms of rise over run or slope then additionally consider what happens when the change in x approaches 0, it becomes evident that the instantaneous rate of change or derivative at any point along the curve is equivalent to the slope of the tangent to the curve at that point.
For an individual peak the slope of that tangent will steadily increase to some maximal positive slope value then decreasing until it reaches zero (point of zero order peak absorbance). At that point the slope begins to change again, up to a maximal negative slope, then once again decreases to zero.
To understand the shapes of higher order derivative spectra, one needs simply apply the same changing slope principle to the current level spectra in order to generate a representative next order spectra.
References:
- https://en.wikipedia.org/wiki/Convolution
- https://en.wikipedia.org/wiki/Deconvolution
- https://en.wikipedia.org/wiki/Fourier_transform
- Botsoglou, N.A., Rapid, Sensitive, and Specific Thiobarbituric Acid Method for Measuring Lipid Peroxidation in animal Tissue, Food and Feedstuff Samples, J. Agric. Food Chem. 42:1931-1937; 1994.
- Brnbrnz - Own work, CC BY-SA 4.0, https://commons.wikimedia.org/w/index.php?curid=43249235
- Abraham. Savitzky, M. J. E. Golay Smoothing and Differentiation of Data by Simplified Least Squares Procedures. Anal. Chem., 1964, 36 (8), pp 1627–1639
- https://en.wikipedia.org/wiki/Savitzky%E2%80%93Golay_filter


